Mobile app development in 2026 isn’t just about building features; it’s about making smart, future-proof investments. As technology accelerates and user expectations rise, the cost of developing an app has become more complex than ever. From AI-driven functionality and cloud infrastructure to evolving privacy regulations, every decision now carries both technical and financial weight.
Whether you’re a startup validating an idea or a business scaling a digital product, understanding where your budget goes is critical. Miscalculations can lead to delays, scope creep, or costly rebuilds. That’s why a clear, structured approach to cost estimation is no longer optional; it’s essential.
In this guide, we break down mobile app development costs in 2026 step by step. You’ll discover what truly drives pricing, how to estimate app development cost with confidence, and how to plan for risks before they impact your budget. From lean MVPs to full-scale applications, this is your roadmap to building smarter, budgeting better, and launching without financial surprises.
Understanding App Development Cost
App costs start with clear basics. Many overlook hidden drivers like backend & infrastructure cost or QA & testing cost planning. Let’s unpack them.
What Is Mobile App Development Cost?
Mobile app development cost represents the total investment required to design, develop, test, launch, and maintain an app. It encompasses:
- Labor costs: developer, designer, and QA hours
- Tools & software licenses: design tools like Figma, development IDEs, analytics platforms
- Backend & infrastructure: servers, databases, APIs, and cloud hosting
- Ongoing support & maintenance: bug fixes, security updates, feature upgrades
In 2026, average costs vary widely:
- Simple MVP (Minimum Viable Product): $50,000–$80,000
- Moderately complex apps (social networking, e-commerce): $100,000–$250,000
- Highly complex apps (AI-driven, real-time updates, AR/VR features): $500,000+
Think of it like Software Development Life Cycle (SDLC) cost modeling: each stage, from concept to maintenance, adds incremental costs. On average, labor accounts for 60–70% of the total cost, while tools, servers, and other infrastructure add 10–20% (industry data from Clutch and GoodFirms).
The cost variability arises from factors like app scope, platform choice, development team location, and technical complexity.
Key Cost Drivers in 2026
Mobile app development costs can be broken into five main drivers:
- Feature Complexity
-
-
- Simple features: login, push notifications, basic forms ($5,000–$10,000 per feature)
- Complex features: machine learning, AR filters, GPS-based tracking ($50,000+ per feature)
- Example: a ride-sharing app’s GPS functionality involves maps API integration, real-time updates, and security considerations, tripling the effort compared to a simple login screen.
-
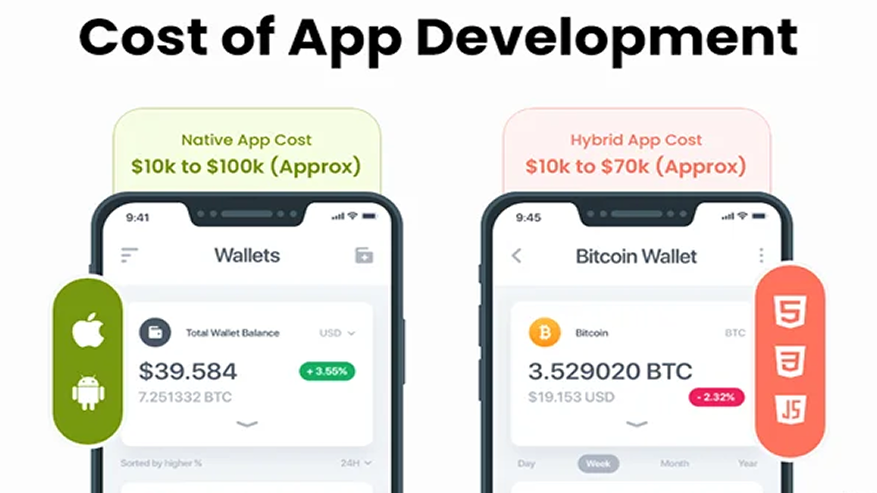
- Platform Choice
-
- Native development: Swift (iOS) or Kotlin (Android)
- Pros: high performance, smoother UX, better integration with device features
- Cons: 1.5–2x higher upfront cost ($100,000+ for full app)
- Cross-platform frameworks: Flutter, React Native
- Pros: faster development, lower initial cost ($60,000+ for MVP)
- Cons: may require native modules for advanced hardware features
- Native development: Swift (iOS) or Kotlin (Android)
In 2026, with technologies like 5G, foldable devices, and IoT integration, platform choice cost impact can influence overall expenses by 30–50%.
- Backend & Infrastructure
-
-
- Cloud hosting, server maintenance, and database management cost $5,000–$20,000 annually
- Real-time apps (messaging, ridesharing) require additional API and server scaling, increasing infrastructure costs
-
- Design & UX
-
-
- Quality UX/UI typically consumes 15–25% of the total budget
- Custom animations, interactive components, or highly branded visuals can further raise costs
-
- QA & Testing
-
- Ensures reliability, security, and bug-free performance
- Typically, 20–30% of the total cost
- Includes unit testing, integration testing, automated scripts, and real-device testing
Each factor interacts differently per project, explaining why apps with similar features may have very different price tags.
How Feature Complexity Impacts Cost
Feature complexity follows a non-linear scale:
- Low complexity: simple forms, static pages ($5,000–$10,000)
- Medium complexity: e-commerce cart, social feed ($15,000–$30,000)
- High complexity: AR, AI, real-time location tracking ($50,000+)
Lesson: Always conduct a backend vs frontend cost analysis to prioritize investments; heavy data apps require more robust backend planning.
Technical complexity scoring can help:
| Feature | Data Handling | AI | Integrations | Complexity Score |
| Login | Low | None | Low | 1 |
| AR Filter | Medium | Medium | Medium | 4 |
| GPS Ride Tracking | High | Low | High | 5 |
This scoring explains why seemingly similar features can vary dramatically in cost.
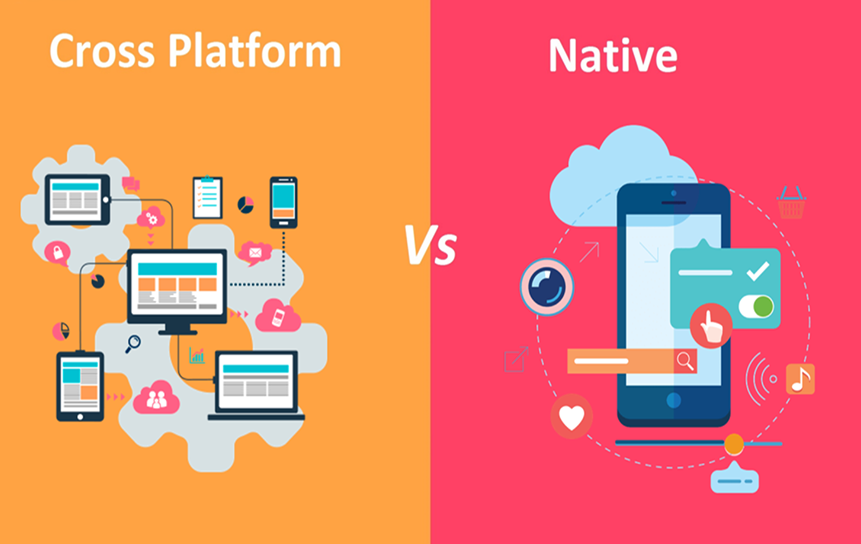
Platform Choice: Native vs Cross-Platform
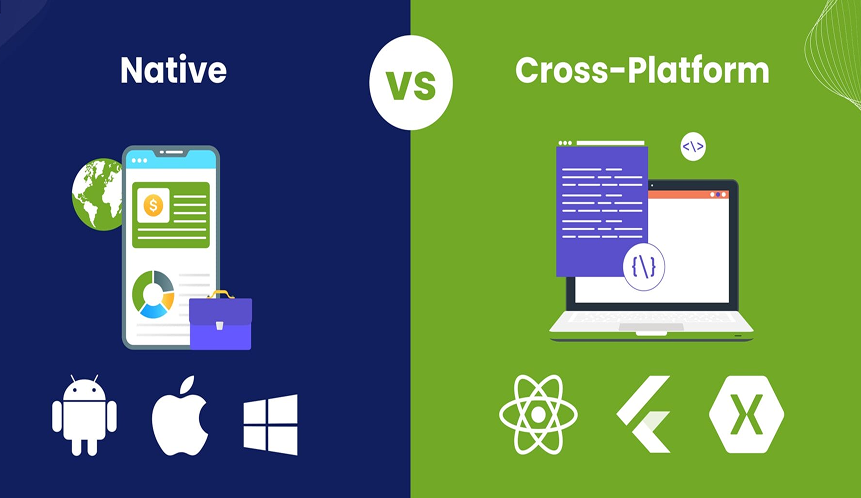
When building a mobile app, one of the biggest decisions is whether to develop natively for each platform (iOS and Android) or use a cross-platform framework. This choice directly impacts cost, performance, and long-term maintenance.
1. Native Apps
What it means: You build separate apps for each platform using platform-specific languages, Swift for iOS and Kotlin for Android.
Pros:
- Better performance: Apps run faster and more smoothly because they are optimized for the platform.
- Full access to device features: Native APIs for cameras, sensors, AR/VR, push notifications, and GPS work seamlessly.
- Lower long-term maintenance: Because each app is optimized for its platform, updates and bug fixes are usually easier to implement.
Cons:
- Higher upfront cost: You’re effectively developing two separate apps, which can increase initial costs by 1.5–2x.
- Longer development time: Each platform requires its own development cycle.
Best for: Performance-heavy apps like games, AR apps, video streaming, or real-time financial apps.
2. Cross-Platform Apps
What it means: You write a single codebase that works on both iOS and Android, using frameworks like Flutter or React Native.
Pros:
- Lower initial cost: One codebase reduces development hours, so the app is cheaper to build initially.
- Faster time-to-market: Launching on both platforms simultaneously is easier and quicker.
- Easier for MVPs: Best if you want to test ideas without heavy investment.
Cons:
- Performance trade-offs: May not run as smoothly as native apps for heavy animations, complex UI, or AR/VR.
- Occasional native tweaks: Some device-specific features may require platform-specific code, adding extra work.
Best for: MVPs, prototypes, simple apps, or startups testing market fit before scaling.
2026 Perspective
With modern technologies like 5G, foldable devices, and AI-powered features, the performance gap between native and cross-platform apps is narrowing, but native apps remain preferable for high-performance, resource-intensive applications, while cross-platform remains a cost-effective solution for smaller, simpler apps or MVPs.
Step-by-Step Mobile App Cost Estimation 2026 Process
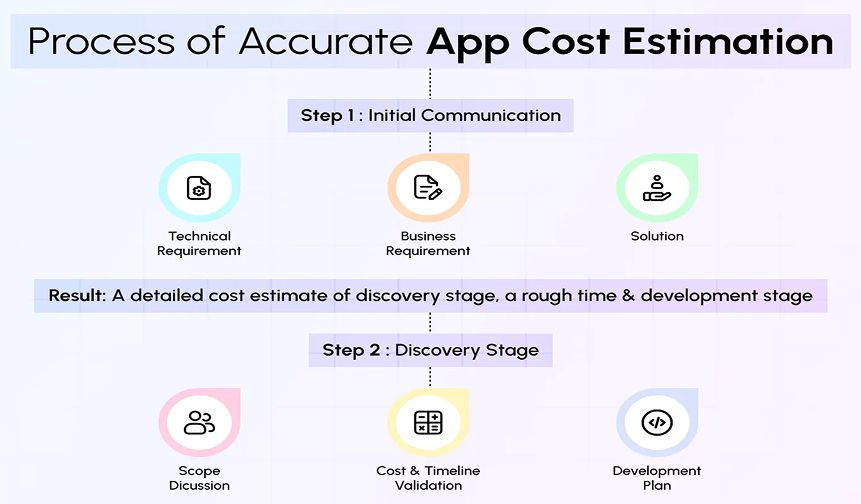
Accurate cost estimation for a mobile app is crucial to avoid budget overruns, missed deadlines, and scope creep. A systematic approach breaks the project into manageable parts, allowing stakeholders to predict costs realistically and allocate resources efficiently.
1. Requirement Gathering and Analysis
The first step is to understand the app’s purpose, target audience, and core functionality. The quality of this phase directly impacts the accuracy of cost estimation.
Key Activities:
- Identify the primary users and define their goals
- Clarify business objectives, such as increasing engagement, improving sales, or streamlining services
- Determine the platforms (iOS, Android, web) the app will support
- Specify non-functional requirements like security, accessibility, compliance, and performance targets
Tools and Techniques:
- Visual mapping with tools like Miro or Lucidchart to outline user journeys
- Collecting user stories to describe how different users will interact with the app
- Prioritization using the MoSCoW method (Must, Should, Could, Won’t) to differentiate essential vs. optional features
By completing this step, you create a comprehensive blueprint that clearly defines what the app needs to achieve, forming the foundation for further estimation.
2. Breaking Down the App via Functional Decomposition
Functional decomposition involves dividing the app into smaller, clearly defined components. This allows precise estimation of development effort and costs for each part of the application.
Why It Matters: Large features are difficult to estimate as a whole. Breaking them into sub-components reveals hidden complexities.
Example: For an e-commerce app:
- Frontend Components: Product catalog, search bar, cart interface
- Backend Components: Inventory management, order processing, user authentication
- Integration Points: Payment gateways (Stripe/PayPal), shipping APIs, third-party analytics
This step also helps identify dependencies between features, ensuring that sequential tasks are planned correctly.
3. Estimating Effort for Each Feature
Once the app is decomposed, assign estimated hours or story points for design, development, backend, and testing.
Method:
- For each feature, calculate the required design effort, frontend coding, backend implementation, and quality assurance.
- Factor in developer experience and speed differences (junior vs. senior developers).
- Include buffer time for collaboration, code reviews, and integration testing.
Illustration: A “Profile Management” feature might involve:
- UI Design: 25 hours
- Frontend Development: 40 hours
- Backend Integration: 35 hours
- QA & Testing: 20 hours
- Total Hours: 120 × $100/hour = $12,000
This granular approach provides transparency and flexibility in budgeting.
4. Selecting an Estimation Technique
Different methods can be applied depending on project scope, complexity, and historical data:
- Bottom-Up Estimation: Aggregate effort estimates from all sub-tasks for precise calculation. Best for highly detailed projects.
- Analogy-Based Estimation: Compare the project with previously completed similar apps to predict costs quickly.
- Parametric Estimation: Use mathematical models like COCOMO II or Function Point Analysis, which quantify effort based on size, complexity, and other parameters.
- Recommended Approach: Combine methods, use bottom-up for complex features, and analogy for benchmarking overall costs. This balances accuracy and practicality.
5. Incorporating Risk and Contingency Costs
Even the best plans face uncertainty. Risk assessment ensures the budget accommodates unexpected delays, technical hurdles, or regulatory changes.
Steps:
- Identify potential risks: API changes, new OS updates, third-party dependency failures
- Assign a risk level: High, Medium, Low
- Allocate contingency percentages:
- High-risk items: 25–30%
- Medium-risk items: 15–20%
- Low-risk items: 10%
Adding a contingency buffer early prevents cost surprises later and supports realistic planning for both startups and enterprise-level projects.
6. Applying Cost Models and Frameworks
Professional cost estimation models turn assumptions into data-driven projections.
- COCOMO II: Predicts effort based on project size, complexity, and developer productivity
- Function Point Analysis: Measures app functionality in terms of inputs, outputs, user interactions, and data files
- Agile Story Points: Useful for iterative development, assigning relative effort to tasks across sprints
- Outcome: These models allow project managers to validate estimates, compare scenarios, and adjust resource allocation before committing to full development.
7. Final Cost Synthesis
Combine all factors:
- Summed feature development costs
- Design and UX expenses
- Backend and integration effort
- QA and testing hours
- Risk-adjusted contingency
This produces a realistic total cost estimate and a phase-wise breakdown, enabling stakeholders to make informed decisions on budgeting, prioritization, and MVP definition.
Feature Complexity Scoring Framework
Estimating mobile app costs precisely requires quantifying the complexity of individual features. A Feature Complexity Scoring Framework assigns numeric values to different aspects of each feature and weights them to reflect their relative impact on development effort.
1. Weighted Scoring Approach
Step 1: Define scoring axes
Each feature is evaluated on multiple dimensions, each contributing a percentage to the total weighted score:
| Axis | Weight (%) | Description |
| Logic / Algorithm Complexity | 30% | How complicated the feature’s internal processing is (e.g., AI algorithms, workflows). |
| UI / UX Complexity | 25% | User interface intricacy, animations, and custom interactions. |
| Integrations | 20% | Connections to APIs, third-party services, or internal systems. |
| Security | 15% | Authentication, encryption, and regulatory compliance. |
| Scalability / Performance | 10% | Ability to handle growth in users, data, or real-time processing. |
Step 2: Score features individually
Assign a score from 1 (low complexity) to 10 (high complexity) on each axis.
Step 3: Calculate weighted score
Multiply each axis score by its weight, sum, and divide by 100.
Example: Chat Feature
| Axis | Score | Weight | Weighted Contribution |
| Logic | 8 | 30% | 2.4 |
| UI | 7 | 25% | 1.75 |
| Integrations | 9 | 20% | 1.8 |
| Security | 6 | 15% | 0.9 |
| Scalability | 5 | 10% | 0.5 |
| Total Weighted Score | — | — | 7.35 |
Step 4: Convert to effort
Multiply the weighted score by a base number of hours to estimate development effort:
Weighted Score × Base Hours = Estimated Hours
7.35 × 100h = 735 hours
This method ensures features with hidden complexity get higher effort allocation, preventing underestimation.
2. Feature Prioritization for Budgeting
Weighted scores are useful not just for estimating effort but also for budget allocation and prioritization:
MoSCoW Method: Classify features as Must, Should, Could, or Won’t. Must-have features receive full budget allocation, while Could/Won’t features can be deferred.
Kano Model: Separates features into Basic, Performance, and Delight categories to balance cost with user satisfaction.
Prioritization ensures resources are focused on high-value, high-complexity features.
Cost Estimation Decision Matrix
A decision matrix helps visualize cost ranges across different app types, platforms, and features.
- Rows: App types (e-commerce, fitness, social networking)
- Columns: Platforms (iOS, Android, Cross-Platform), feature sets (MVP, full-featured, premium)
- Cells: Estimated cost ranges
Example:
| App Type | Platform | MVP Features | Full Features |
| E-commerce | Cross-platform | $80k–$120k | $150k–$200k |
| Fitness | Native iOS | $100k–$130k | $180k–$250k |
| Social Media | Native Android | $120k–$160k | $250k+ |
This matrix is useful for initial budgeting discussions and investor presentations, as it clearly shows how costs scale with features and platform choice.
Agile & Iterative Estimation Techniques
Modern mobile app development is often Agile and iterative, which allows for progressive refinement of cost estimates:
- Story Points: Features are assigned relative complexity points. Teams estimate how many points can be completed per sprint.
- Sprint-Based Costing: Each sprint reveals actual development effort versus planned estimates, allowing refinement for subsequent sprints.
- Prototype Feedback: Early prototypes can uncover hidden technical challenges, improving accuracy in future cost projections.
This approach avoids committing to a single fixed cost upfront and keeps estimates realistic as the project evolves.
Historical Validation & Benchmarking
Cost estimation is strengthened by validating against historical data and industry benchmarks:
- Historical Validation: Compare estimates with past projects of similar size and complexity. For example, past fitness app projects often hit 80% of estimated effort when buffers were included.
- Benchmarking Tools: Platforms like App Annie or GoodFirms provide average development costs for app categories.
- Example: Fitness apps average around $120k for a cross-platform MVP
- E-commerce apps often range $100k–$180k depending on integrations and complexity
Using historical and benchmark data ensures estimates are grounded in reality rather than intuition.
Backend, QA, and Infrastructure Cost Modeling

Backend systems, quality assurance (QA), and infrastructure are critical yet often underestimated cost components in mobile app development. Cutting corners here can lead to security breaches, poor performance, and exponentially higher post-launch costs. In 2026, with growing app complexity, cloud reliance, and real-time features, careful modeling of these costs is essential.
1. Backend Architecture & Cloud Services Cost
The backend is the central engine powering the app, managing data, APIs, business logic, authentication, and integrations. A robust backend ensures scalability, security, and smooth operation under varying user loads.
Cost Distribution
- Industry benchmarks show frontend costs ~40% of total app cost, backend ~30%, and the remaining for QA, infrastructure, and maintenance.
- Backend costs include server-side development, database setup, API creation, security implementation, and integration with third-party services.
Technology Stack Considerations
- Node.js + Firebase: Efficient for real-time apps with moderate traffic; ~$2,000/month for 10,000 active users.
- AWS or Google Cloud VMs: Needed for apps with high traffic, large data, or AI features. Full server instances cost more but provide flexibility, control, and enterprise-grade security.
- Serverless architecture (AWS Lambda, Google Cloud Functions): Reduces idle server costs by scaling automatically with user demand; ideal for apps with unpredictable load.
Scalability Planning
- Estimate 10–15% extra in backend cost to account for growth, concurrent users, and data spikes.
- Proper backend design prevents future costly refactoring when the app grows.
Security
- Backend vulnerabilities are the root cause of over 80% of data breaches.
- Budget must include encrypted data storage, secure API endpoints, multi-factor authentication, and monitoring tools.
Example: A ride-sharing app with real-time location updates requires robust backend servers, database sharding, and scalable APIs. Backend effort could be $50,000–$100,000, depending on user scale.
2. QA & Testing Cost Breakdown
Quality assurance ensures the app works reliably, meets requirements, and provides a smooth user experience. Investing in QA prevents expensive post-launch fixes.
Budget Allocation
- QA and testing typically consume 20–25% of the total development cost.
- Costs vary depending on testing type:
- Manual testing: ~$10,000, exploratory testing, usability, and edge-case detection.
- Automated testing (Appium, Selenium): ~$15,000 upfront, but reduces regression testing time for future updates.
Testing Components
- Unit Testing (30%): Validates individual functions and modules to ensure correctness.
- Integration Testing (40%): Ensures modules, APIs, and third-party integrations work together correctly.
- User Acceptance Testing (30%): Confirms the app meets user expectations and business requirements.
Impact on Total Cost
- Early QA prevents 10x cost increases from post-launch bug fixes or crashes.
- For example, fixing a critical API bug after deployment may cost $50,000+, whereas proactive QA detects it at a fraction of that cost.
Additional Considerations
- Cross-device testing: iOS vs Android, different screen sizes, foldables, 5G network conditions.
- Performance testing for high-traffic apps or real-time features to prevent crashes.
3. Maintenance & Scalability Considerations
Post-launch costs are ongoing and often overlooked in initial estimates, but they are essential for long-term app success.
Maintenance Costs
- Typical yearly maintenance: 15–20% of initial app cost.
- Covers OS updates, bug fixes, security patches, performance optimization, and minor feature enhancements.
Scalability Planning
- Budget for user growth and peak traffic spikes.
- Example: If a fitness app has 10,000 users initially, scaling to 100,000 users may require database sharding, load balancing, and additional servers, roughly 15% extra in infrastructure costs.
Technical Debt Management
- Deferred or sub-optimal code leads to “technical debt.”
- Agile sprints often allocate ~20% of capacity to address technical debt, reducing cumulative maintenance costs over time.
- Include technical debt hours in budget forecasts to prevent hidden future costs.
4. Infrastructure Cost Modeling
Infrastructure includes servers, storage, CDN, monitoring, and security services.
- Cloud Services:
- AWS EC2, Google Cloud VMs, or serverless platforms scale based on traffic.
- Serverless reduces idle costs but may have higher per-request costs.
- Database & Storage:
- Relational DBs (PostgreSQL, MySQL) vs. NoSQL (MongoDB, Firebase).
- Cost depends on storage, query complexity, and redundancy requirements.
- Monitoring & Analytics:
- Tools like Datadog, New Relic, or Firebase Crashlytics provide real-time performance monitoring.
- Typically adds 5–10% to infrastructure budget.
Example: For a medium-scale e-commerce app:
- Backend + infrastructure: $50,000
- QA & Testing: $15,000
- Year 1 Maintenance: $7,500–$10,000
- Contingency/Scalability Buffer: $7,500
- Total Backend + QA + Infrastructure Cost: ~$80,000–$85,000
Validation, Optimization & Mistakes to Avoid
Estimating mobile app development cost is a dynamic process, not a one-time calculation. Without validation and iterative refinement, even carefully calculated budgets can deviate significantly from reality.
1. Iterative Refinement & Cost Calibration
Purpose: Ensure initial estimates align with actual effort and costs.
Step 1: Prototype & MVP Development
- Build a Minimum Viable Product (MVP) first to reveal hidden complexities in features, integrations, and backend systems.
- Example: An e-commerce app may seem simple in planning, but real-time inventory syncing and payment gateway issues might reveal additional backend hours.
Step 2: Compare Actuals to Estimates
- Track hours spent, resource utilization, and infrastructure costs.
- Identify areas where estimates were off, overestimation, or underestimation.
Step 3: Adjust Future Sprints or Phases
- Refine remaining cost projections based on actual MVP results.
- Update risk buffers, resource allocation, and timeline forecasts.
Outcome: Iterative estimation reduces surprises, aligns budgets with reality, and improves stakeholder confidence.
2. Common Estimation Mistakes & How to Avoid Them
Even experienced teams can make recurring errors when estimating app costs. Awareness of these mistakes allows proactive prevention.
| Mistake | Impact | Solution |
| Underestimating API & Integration Costs | Can double backend development time | Conduct detailed integration analysis; include third-party costs and authentication workflows |
| Ignoring Design & UX Costs | High-quality UI/UX can account for 15–25% of the budget; skipping leads to poor adoption | Include wireframes, animations, accessibility, and prototype iterations in estimates |
| No Contingency Budget | 30–40% cost overrun when unexpected issues occur | Always include a 20–30% risk buffer; account for regulatory, technical, or operational delays |
| Overlooking Testing & QA | Leads to expensive post-launch fixes | Allocate 20–25% of the budget for QA cycles, including manual and automated testing |
| Relying Solely on Historical Analogy | Past projects may not match current complexity or tech stack | Combine bottom-up, analogy, and parametric methods for strong estimates |
Best Practices:
- Peer reviews of cost estimates
- Phase-gated budgeting: approve funds incrementally, after validating earlier phases
3. Optimizing Cost Without Sacrificing Quality
Cost optimization doesn’t mean cutting corners; it’s about strategic resource allocation and smart choices.
Approaches to Optimize Costs
- Prioritize MVP Features
- Focus on must-have features first; defer nice-to-have functionality for later releases.
- Reduces initial scope, lowers upfront development hours, and provides early market feedback.
- Leverage Outsourcing Strategically
- Outsource specialized tasks like QA or design to experienced vendors for lower rates without compromising quality.
- Use No-Code or Low-Code Tools for Prototyping
- Build prototypes and validate user flows without full development costs.
- Allows stakeholders to test and approve features before committing developer hours.
- Cross-Platform Development
- Flutter, React Native, or Xamarin can reduce development cost by up to 40% for MVPs and apps with moderate platform-specific requirements.
- Trade-offs: may need native modules for high-performance features, but still saves overall development time.
- Agile Iteration for Cost Efficiency
- Continuously review and reallocate resources during sprints based on performance, feature complexity, and user feedback.
Example of Cost Optimization in Action
Initial estimate for a social networking MVP: $120,000 (native iOS + Android).
Optimization steps:
- Prioritize MVP: save $20,000 by deferring advanced search and filters
- Cross-platform Flutter implementation: saves $25,000
- Outsourced QA automation: saves $5,000
- Optimized MVP Cost: $70,000–$75,000, without sacrificing core quality
Practical Checklists & Best Practices: Quick Tools for Success

Checklists are more than reminders; they are structured frameworks that ensure thorough planning, minimize risks, and make cost estimation more precise. Following them at each stage of development can prevent costly oversights, reduce scope creep, and improve project predictability.
1. Requirement Gathering Checklist
Purpose: Build a solid foundation by clearly defining what the app will do, who it will serve, and which technologies will support it. Early clarity reduces miscommunication, development rework, and budget overruns.
Key Items:
- User personas defined
-
-
- Identify target demographics, habits, motivations, and pain points.
- Example: Fitness app personas could include “Busy Professionals” who need 5–10 minute workouts and “Health Enthusiasts” tracking nutrition and goals.
- Cost impact: Helps prioritize features that provide real value, reducing wasted development effort.
-
- User flows mapped
-
-
- Visualize the complete journey: onboarding → core feature → notifications → analytics.
- Tools: Miro, Figma, Lucidchart.
- Example: Signup → Profile setup → Goal selection → Activity tracking → Progress report → Social sharing.
- Benefit: Reduces overlooked steps that often cause extra coding hours.
-
- Tech stack chosen
-
-
- Decide on front-end, back-end, database, APIs, and cloud services.
- Example: Flutter (cross-platform) + Node.js + Firebase + Stripe for payments.
- Impact on cost: Cross-platform reduces upfront coding hours; native may increase upfront but reduces long-term maintenance costs.
-
- Feature prioritization
-
-
- Use MoSCoW or Kano frameworks to identify must-haves vs. nice-to-haves.
- Example: Must-have: login, tracking, notifications; Could-have: AI coach, gamification.
- Cost implication: Avoids investing in low-priority features before validating MVP.
-
- Compliance and security considerations
-
- GDPR, HIPAA, COPPA, and accessibility (WCAG) requirements.
- Example: A fitness app storing health data requires HIPAA compliance.
- Cost impact: Ignoring compliance can cause legal fines, app rejection, and additional redevelopment.
2. Feature Decomposition Checklist
Purpose: Break app functionality into granular, measurable tasks to improve effort estimation and risk mitigation.
Key Items:
- Tasks granular (under 8 hours)
-
-
- Example: “Add push notifications” → Backend API + Frontend UI + Scheduler.
- Smaller tasks are easier to estimate, assign, and track.
-
- Dependencies noted
-
-
- Identify features that rely on others.
- Example: Chat module depends on authentication, backend messaging API, and database schema.
- Cost impact: Prevents hidden blockers that can delay development.
-
- Complexity scored
-
-
- Weighted scoring: logic 30%, UI 25%, integrations 20%, security 15%, scalability 10%.
- Example: Chat feature → weighted score 8.1 → 810 developer hours at 100h base.
-
- Integration points listed
-
- Include third-party APIs, SDKs, analytics, and payment gateways.
- Example: Stripe integration includes authentication, validation, webhooks, and notifications.
Outcome: Allows more accurate cost, effort, and timeline estimation by quantifying each feature.
3. QA Planning Checklist
Purpose: Prevent costly post-launch errors and ensure app quality, stability, and user satisfaction.
Key Items:
- Test cases per feature
-
-
- Unit tests (validate individual functions)
- Integration tests (ensure modules work together)
- Functional tests (verify expected outcomes)
- Example: Login feature tested for valid/invalid credentials, password reset, and edge cases.
-
- Automation plan
-
-
- Automate repetitive tests for regression and scalability.
- Tools: Appium, Selenium, and Cypress.
- Benefit: Saves significant QA time over long-term maintenance.
-
- Load and performance testing budgeted
-
-
- Especially for real-time or high-traffic apps.
- Example: Fitness app with live activity feed requires testing under 10k concurrent users.
-
- Cross-device and OS testing
-
- Cover iOS, Android, foldables, tablets, and multiple resolutions.
- Example: Push notification behavior differs between Android 12 and Android 14.
Cost impact: QA may consume 20–25% of the total budget, but prevents 10x post-launch fix costs.
4. Release Readiness Checklist
Purpose: Ensure the app is fully prepared for launch, minimizing delays, user dissatisfaction, or app store rejection.
Key Items:
- Beta users recruited
-
-
- Early testing uncovers usability issues, bugs, and performance bottlenecks.
- Example: 100 beta users provide insights on navigation and notifications.
-
- App Store / Play Store preparation
-
-
- Metadata, screenshots, privacy policy, review compliance, and category selection.
-
- Analytics integrated
-
-
- Track user engagement, retention, crash reporting, and feature adoption.
- Example: Firebase Analytics for session duration and goal completion.
-
- Deployment pipeline ready
-
- CI/CD for fast patch releases and updates.
- Reduces long-term maintenance cost and downtime risk.
5. Risk & Contingency Checklist
Purpose: Identify, quantify, and mitigate risks to avoid budget overruns and project delays.
Key Items:
- Top risks listed
- API changes, server downtime, third-party SDK updates, OS upgrades, security breaches.
- Buffers allocated
- Add 20–30% contingency to cover unexpected challenges.
- Example: New OS version breaking app functionality.
- Mitigation plans defined
- Alternative APIs, fallback features, and pre-provisioned scalable infrastructure.
- Technical debt planning
- Include 15–20% sprint capacity for refactoring and fixing early shortcuts.
Outcome: Reduces the probability of 40%+ budget overruns and improves confidence in cost estimates.
Real-World Scenarios & Case Examples: Seeing Mobile App Cost Estimation in Action
Practical examples turn abstract budgeting concepts into tangible insights, helping answer what drives mobile app development cost and how to forecast mobile app budget effectively. By applying SDLC cost modeling, software effort estimation, and iterative project estimation, these scenarios show how app type, platform, and development approach influence the overall development lifecycle cost.
1. MVP vs Full App Cost Scenario
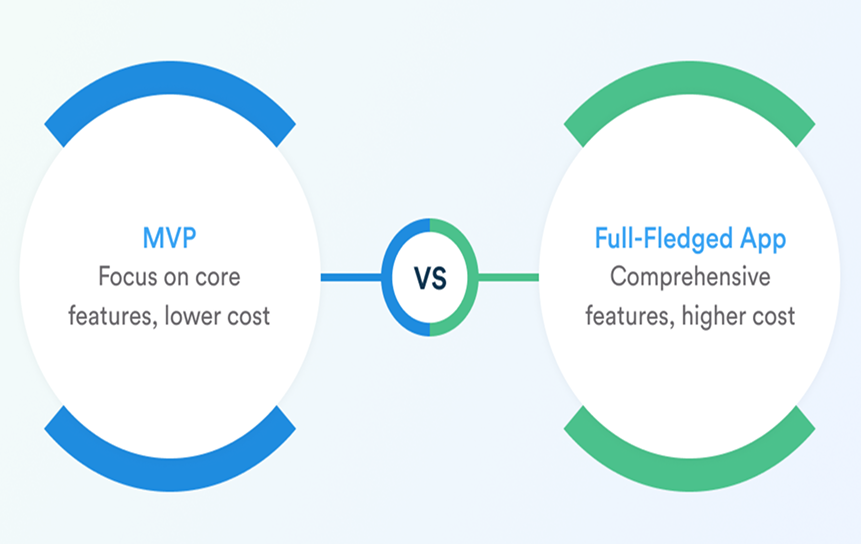
Purpose: Understand how scope, MVP cost analysis, and feature prioritization (MoSCoW, Kano) for budgeting affect total cost.
Example: Fitness Tracker App
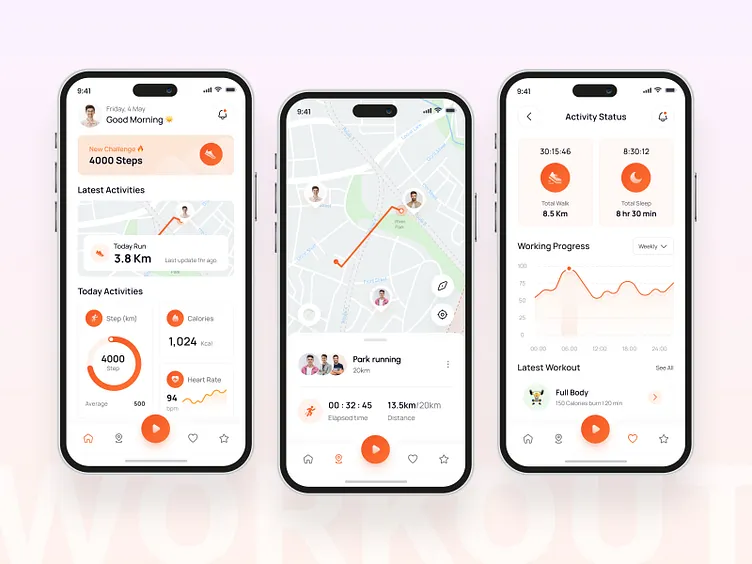
MVP (Minimum Viable Product)
- Features: Activity tracking, goal setting, basic reports
- Estimated cost: $60,000
- Timeline: 8–12 weeks
- Focus: Validate assumptions using technical complexity scoring and developer productivity metrics
Full App
- Additional features: AI coach, gamification, analytics, notifications
- Estimated cost: $250,000
- Timeline: 20–28 weeks
- Includes: Higher UI/UX design complexity, integration & API cost, and cloud infrastructure budgeting
Lesson:
Launching an MVP enables feature prioritization frameworks and supports historical validation of app cost estimates using real user data. This also helps explain why app costs differ for similar features; complexity, integrations, and scalability all play a role.
2. Cross-Platform vs Native App Cost Comparison
Purpose: Show how platform choice impacts cost and long-term scalability.
Example: E-commerce App

Native App
- iOS + Android development
- Cost: $180,000
- Benefits: Performance, monetization
- Higher development lifecycle cost due to separate builds
Cross-Platform App
- Single codebase
- Cost: $110,000
- Faster delivery using agile estimation for mobile apps
Lesson:
Choosing the right platform is key to budgeting for mobile app scalability. In 2026, platform decisions combined with performance requirements can significantly shift costs. Early risk & contingency modeling is essential to avoid surprises.
3. Backend vs Frontend Effort & Cost Example
Purpose: Demonstrate backend vs frontend cost analysis in real-world apps.
Example: News App
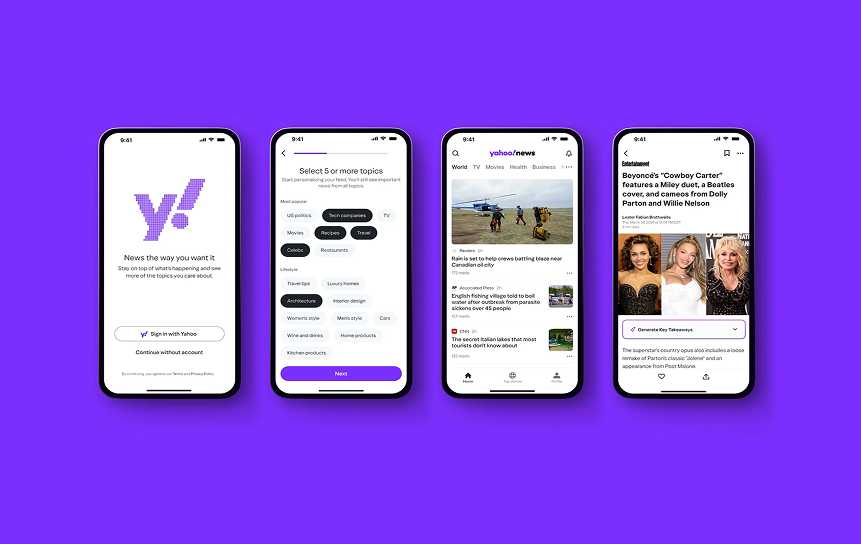
Frontend
- Features: UI, feeds, search
- Cost: $30,000
- Driven by UI/UX design complexity
Backend
- Features: CMS, APIs, data storage
- Cost: $40,000
- Driven by cloud infrastructure budgeting and integration & API cost
Observation:
- Backend dominates in data-heavy apps
- Frontend scales with design complexity
Lesson:
A proper backend vs frontend cost analysis helps teams optimize investments and understand how to optimize app cost without losing quality.
4. Iterative Estimation in Agile Projects
Purpose: Highlight agile estimation for mobile apps and continuous cost refinement.
Example: Authentication Module
- Sprint 1: Estimate vs actual comparison
- Sprint 2+: Forecast using velocity
This reflects functional point analysis, iterative project estimation, and real-time developer productivity metrics.
Lesson:
- Improves accuracy over time
- Supports how to validate app cost estimates
- Reduces risk of underestimation
5. QA, Maintenance & Hidden Costs Scenario
Purpose: Explain when to include QA and infrastructure costs and the impact of estimating QA and maintenance costs.
Key Cost Areas:
- QA/test cycle cost (20–30% of budget)
- maintenance & updates cost (ongoing)
- Infrastructure scaling via cloud infrastructure budgeting
Lesson:
Ignoring these leads to inaccurate forecasts and explains what happens if estimates are underestimated, delays, budget overruns, and reduced quality.
Conclusion
In 2026, mobile app development requires more than feature planning; it demands structured software effort estimation, smart budgeting for mobile app scalability, and continuous validation. From MVP cost analysis to full-scale deployment, every stage should include risk & contingency modeling, integration & API cost planning, and historical validation of app cost estimates.
Whether you’re a startup or an enterprise, understanding what drives mobile app development cost and applying feature prioritization (MoSCoW, Kano) for budgeting ensures smarter decisions. By combining agile estimation for mobile apps, backend vs frontend cost analysis, and proper estimating of QA and maintenance costs, you can build high-quality apps without unnecessary overspending.
Book a consultation with us to streamline your workflows and enhance internal process control today.
FAQs
Answering the most common questions about the cost of developing mobile apps makes things clear for both beginners and advanced users.
1. What drives mobile app development cost?
Several factors influence the total cost of an app. The biggest drivers include feature complexity, UI/UX design complexity, number of platforms, and backend infrastructure. Advanced features like AI, real-time updates, or third-party integrations increase integration & API cost and require more development effort. Additionally, cloud infrastructure budgeting and scalability needs can significantly raise long-term expenses.
2. How to forecast mobile app budget accurately?
Accurate forecasting relies on structured SDLC cost modeling and software effort estimation. Start with functional decomposition for app budgeting (breaking the app into smaller tasks), then apply technical complexity scoring and developer productivity metrics to estimate effort. Using agile estimation for mobile apps and iterative project estimation improves accuracy over time as real data becomes available.
3. Why do app costs differ for similar features?
Even similar features can vary in cost due to differences in architecture, performance requirements, and integrations. For example, a chat feature with real-time syncing and encryption will cost more than a basic messaging system. This is where technical complexity scoring and integration & API cost analysis explain why app costs differ for similar features.
4. When should QA and infrastructure costs be included?
QA and infrastructure should be included from the beginning—not added later. Estimating QA and maintenance costs ensures you account for QA/test cycle cost, bug fixing, and performance testing. Infrastructure costs like servers and scaling fall under cloud infrastructure budgeting and should be planned early to avoid underestimation.
5. How to optimize app cost without losing quality?
Focus on MVP cost analysis and prioritize features using feature prioritization (MoSCoW, Kano) for budgeting. This helps deliver only high-value features first. Combine this with backend vs frontend cost analysis to allocate resources efficiently, and use feature prioritization frameworks to avoid unnecessary development.
6. How to validate app cost estimates?
Validation comes from comparing planned vs actual results using historical validation of app cost estimates. Agile teams refine estimates through sprints using iterative project estimation. Techniques like functional point analysis also help ensure estimates are realistic and aligned with industry benchmarks.
7. What happens if estimates are underestimated?
Underestimation leads to budget overruns, delays, and sometimes incomplete products. Without proper risk & contingency modeling, teams may run out of resources mid-project. This is why adding a 20–30% buffer and continuously refining estimates is critical.
8. How does platform choice impact cost?
Platform decisions directly affect development and maintenance costs. Native apps usually cost more upfront, while cross-platform apps reduce initial expenses. However, how platform choice impacts cost also depends on scalability and performance needs. This makes budgeting for mobile app scalability essential when planning long-term investments.
9. How do backend and frontend costs compare?
The balance depends on the app type. Data-heavy apps require stronger backend systems, increasing costs related to APIs, servers, and databases. A proper backend vs frontend cost analysis helps identify where to invest more and ensures efficient resource allocation.
10. How much should be allocated for maintenance and updates?
Ongoing costs typically range from 15–25% of the initial development cost annually. These include maintenance & updates costs, bug fixes, performance improvements, and adapting to OS updates. Ignoring these costs can lead to long-term technical debt and reduced app performance.


