
A lot of companies still rely on Crystal Reports for preparing their business reports. Although Crystal Reports has been a great resource over the years, it has now become a tough challenge to support and it is unable to meet new reporting needs. Power BI, on the other hand, is a very user-friendly tool that presents data in a clear, visual, and attractive manner and hence many organizations are switching from Crystal Reports to Power BI.
The purpose of this guide is to walk you through the entire process of migration in a simple and crystal clear manner. Being a technical expert is not a requirement in order to follow our explanation. Migration is what we will discuss, its importance, and how it can be executed step by step. You will get to know what to prepare for, what difficulties to look out for, and how to steer clear of the pitfalls!
But, the biggest benefit to you will be that you will discover how much Power BI can improve the speed, convenience, and usefulness of reports for making decisions. So, if you are planning to modernize your reporting, this guide will give you the green light and confidence to begin the process. So are you the next business that wants to migrate from Crystal Reports to Power BI?
What is Crystal Reports and How it Structures Data?
Crystal Reports is a report creation software that takes out data from a database and presents it in a friendly manner. It structures the data in the form of a table and this along with the use of fields makes the whole thing easy to read and print. The users have the option to filter the data through questions in a manner that only the selected data is included.
The usual case with the reports is that they are static, which means that there is no change in the layout and the figures when the reports are viewed. Power Report Conversion allows organizations to seamlessly transform traditional reports into modern, interactive analytics experiences. Hence, it is important to understand Power BI dashboards vs. Static Crystal Reports!
Users cannot connect with the reports generated by Crystal Reports in an engaging manner like clicking buttons to access different aspects of the data or filter for specific criteria. Crystal Reports help users in generating visually appealing, professionally formatted, and consistently structured reports, while being unable to provide interactive data visualizations or dashboards. A well-planned legacy reporting modernization initiative helps organizations improve performance, scalability, and data accessibility.
The primary purpose of Crystal Reports is to create simple, printed documents that summarise the information held on a database using pre-defined structures. Whereas, many organizations continue to utilize Crystal Reports for their traditional reporting purposes (over 70,000 global customers), the current trend is towards utilizing databases with more versatile options for data analysis and visualisation.
The below describes how data can be organized:
- Data Organization – Data is typically organized in a series of Rows/Columns, like a spreadsheet. Each Column has a specific type of information and each Row is a unique record.
- Table Relationships – You can set up relationships between tables using a Key (e.g. a Customer ID in the Customers table related to Orders table).
- Star Schema/Fact tables – Star Schema consists of Fact tables (numbers such as Sales) and Dimension tables (data such as Product Name) to improve the speed of Reports.
- Data Hierarchies – Data can be organized with hierarchical levels (Year → Month → Day) to make exploration easier.
Understanding Power BI Architecture and Semantic Models
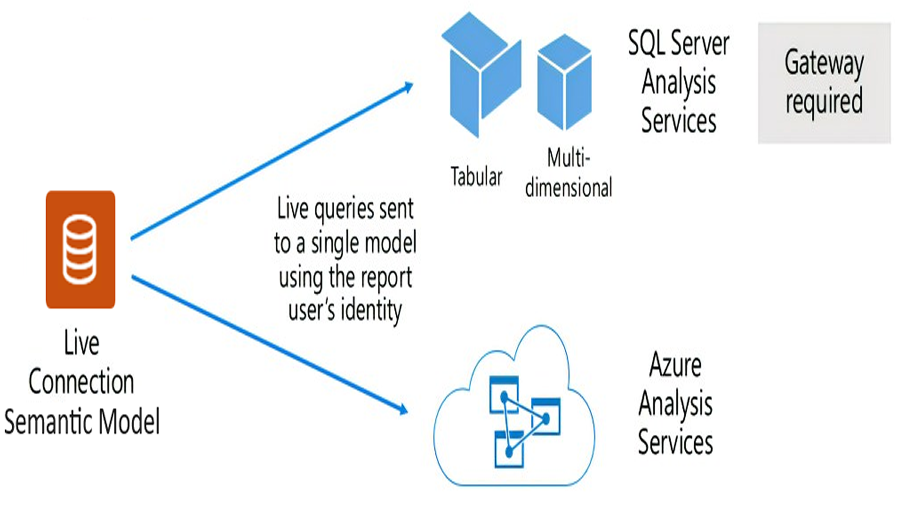
The layers of Power BI contain the core of Power BI. The Power BI Architecture is made up of Semantic models that define the tables, relationships and calculations used in Power BI to present the data as one single source of truth across Reports and Dashboards. The key to making sure every Report and Dashboard in Power BI is based upon the same Data is by either importing Data into Power BI or connecting to it directly from a Database.
Power Query creates clean and usable data while DAX creates calculations and measures to use within reports and dashboards. Reports and dashboards sit on top of the model allowing users to filter, drill down, and interact with their data. Because of this hierarchy, creating and using reports has improved speed, trust, and support for decision-making for both simple and complex analytics across organizations.
No singular solution is enough for all business intelligence solutions in your organization that looks for semantic data modelling in Power BI. As of 2025, over 65,000 organizations will be using Power BI with a market penetration of nearly 30% globally. Thus far, this architecture has proven to be well-adopted across organizations.
Key Differences Between Static and Interactive Reporting
| Feature | Static Reporting | Interactive Reporting |
| Layout | Fixed and print-ready format | Flexible and dynamic dashboards |
| User Interaction | Limited (cannot click or filter) | Users can click and filter |
| Data Updates | Usually needs manual uplift | Can refresh on its own (setup data refresh in Power BI after migration) |
| Analysis | Preset and fixed calculations | Users can discover data and perform ad-hoc calculations |
| Visuals | Basic charts and tables | Rich visuals, charts, maps and slicers |
| Decision Support | Provide static real-time data insights (statics vs. interactive reporting) | Support deeper insights and collective discovery |
| Availability | Printed on PDF Format | Web, mobile and desktop availability |
When and Why Crystal Reports Migration Matters?
Modernize Crystal Reports with interactive Power BI dashboards! Due to the increased speed, ease of updating, and collectivity of reports in Power BI compared with Crystal Reports, migrating from Crystal Reports to Power BI will be useful for business owners that use Crystal Reports to create their reports.
Crystal Reports has been used for years, as it provides businesses with the tools important to create fixed and printed reports; however, Crystal Reports cannot support data discovery or user-friendly dashboards. As such, today’s business owners are looking for informative and actionable reports that help them quickly make better decisions. Currently, approximately 67% of businesses are utilizing BI tools, and therefore, the number is increasing every day.
The investment by businesses in BI tools will also increase by approximately 91% in the upcoming years as a result of the increasing need for BI tools. In addition to quickly creating informative reports with Power BI, companies that migrate to Power BI can also reduce the amount of time spent maintaining their reports (by 27%) and will see lower costs linked with the use of their reports (by 20%) because of the time saved by being able to create informative reports immediately through the use of a BI tool. The report provided by BI tools also allows for the visualization of data, which will help in creating better solutions to improve operations through better and more accurate decision making.
The change over to Power BI gives companies the power to apply data filters, to get inside their reports, and it allows users to see all their data using visuals. Besides, modernization of BI stack has also led to better and more accurate reporting. Indeed, it is due to proper maintenance of reports as all data related to reports are stored in one place central to the location.
-
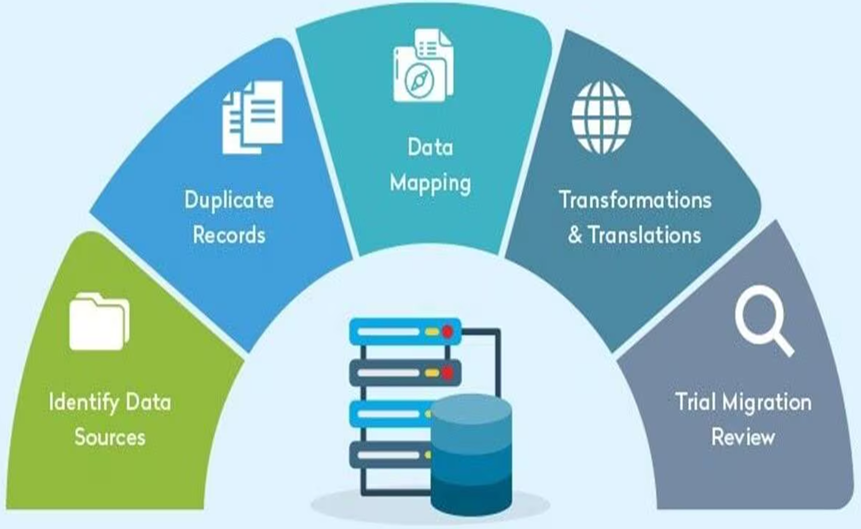
Pre-Migration Planning and Assessment
Prior to the migration process, it is important to find out the whole line of reports, data sources, and needs of users. This is essential for performance and scalability in BI. Knowing which reports are crucial, which ones need to be re-designed and the goals is the first step. The organization of the entire process is done through planning and it thus cuts down risks and surprises.
-
Building a Report Inventory and Usage Prioritization
Gather a full report on the current reports and keep a record of their usage frequency. Start by finding reports that are high-priority and critical for the business. Migration will be more efficient and less costly if low-usage or out of date reports are redesigned.
-
Defining Migration Requirements and Success Criteria
Establish simple goals for the migration, e.g. brief numbers, better visuals, and quicker performance. Decide the criteria for what will be regarded as “success”. Write down the expectations and outcomes to be able to track progress and to make sure there is a common understanding among stakeholders about the characteristics of a successful migration.
-
Data Source Mapping and Compatibility Evaluation
The first thing you need to do is to make a list of all data sources and then check if Power BI can connect these sources. In this way, it is possible to identify compatibility issues beforehand. Knowing the data flow and access will prevent problems during the migration process.
-
Choosing Between Manual vs Automated Migration Paths
Automated tools can be used for migrating simple reports, while complex reports will need manual work. On the other hand, manual migration allows the very careful rebuilding of logic, layout, and interactivity. Selecting the correct approach will result in a compromise between speed, cost, and report quality.
Data Architecture Fundamentals for Migration
-
Introduction to Star Schema & Semantic Models
In a star schema, fact tables (numbers) are completely different from dimension tables (descriptions). This leads to both better performance and clearer understanding. Semantic models are built on star schema and ensure that relationships and calculations are altogether across all reports in Power BI.
-
Preparing Data with Power Query (M Language Essentials)
Power Query is the tool that helps in the whole process of cleaning, shaping, and combining data creation before report creation. It does this by correcting errors, changing formats, and making data uniform. All this preparation work done properly means that reports are accurate and there will be fewer problems later on during the migration process.
-
How to Translate Crystal Formula Logic into DAX?
Translating crystal formulas into DAX is not a simple process. Initially, explain each formula correctly. After that, use the DAX function in Power BI to create it again. The more difficult the calculation is, the more you will need to break it down into smaller parts and test them perfectly to ensure the results correspond to the original ones.
-
DirectQuery vs Import Mode: When to Use Which
Import mode is the one that keeps data in the Power BI database, which makes the reports rendered faster. In contrast, DirectQuery allows access to the database, but it can be slower. Choose the mode depending on data size, speed needs, and how often updates are needed.
Step-by-Step Crystal Reports To Power BI Migration
When evaluating Crystal Reports vs. Power BI, organizations often consider flexibility, scalability, and self-service analytics capabilities. The manual migration process involves a tough and careful rebuilding of the reports in Power BI, step by step. For each report, its data is analyzed, prepared, the calculations are recreated, the layout is rebuilt, and finally evaluation is done. This ensures that the reports are both accurate and successful.
-
Step 1 – Source Report Analysis and Inventory
Manual migration means rebuilding reports carefully in Power BI, step by step. Each report is analyzed, data is prepared, calculations are recreated, layouts rebuilt, and final validation is done. This ensures accuracy and performance.
-
Step 2 – Data Modeling Preparation and Design
Create data tables and relationships in Power BI. A well-built model will improve your performance by providing a foundation for calculations, and it will also allow you to scale your reporting efforts into the future. It is an important part of any data model to use data and relationships as the basis for creating reliable, interactive, and accurate reports.
-
Step 3 – Rebuilding Logic in Power BI (DAX & Measures)
Re-create formulas using DAX & measures. As you begin with DAX conversion, divide your formulas into smaller pieces, and test results frequently to ensure the logic in your new reports matches the numbers in your original reports.
-
Step 4 – Recreating Report Layouts & Interactivity
Design visual items like filters, slicers, and drill-throughs within the report layout translation for use by your end-users. It is important to focus on usability and the business value of using descriptive layouts from Crystal Reports, rather than only attempting to copy them.
-
Step 5 – Validation and Quality Assurance
Confirm and verify that all numerical, visual, and filter results are accurate. Compare original reports to ensure numbers are the same. By providing pre-release testing, you’ll reduce errors, increase quality, and increase user confidence in your reports.
-
Step 6 – Deployment and Publish Best Practices
Publish reports to the correct workspace, with proper access rights and permissions, as well as using continuous versioning and naming conventions. By following the best practices, your reports will be efficient, secure, organized, and manageable for future changes!
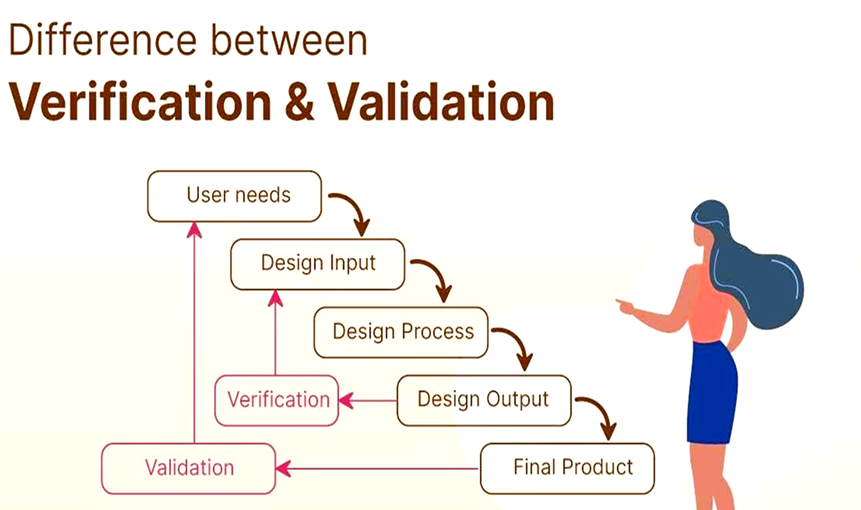
Validation & Quality Assurance Framework
-
Data Reconciliation Methodologies
Reunite the sums, counts, and main signs of the old and new reports. Verify the application of filters and the correctness of formulas. It is a process that ensures data uniformity, thereby increasing user trust and validation of the migration’s success.
-
Performance and Rendering Verification
Measure the time it takes for reports to load and interactivity. Verify the proper function and availability of the dashboards on several devices. Improving the visuals and the models not only enhances the speed but also secures a pleasant user experience.
-
Security and Access Validation (Row-Level Security)
Confirm that the data seen by users is the one they have the right to access. Check the roles, permissions, and access levels. Suitable security measures not only guard sensitive data but also allow the firm to remain compliant with its policies.
-
UAT and Stakeholder Sign-off Criteria
Allow the end-users to test the reports and to give their supportive feedback about the needs. Collect user comments, change reports and ask for proper approval. The sign-off guarantees that all parties agree that the reports are ready for production use.
Post-Migration Considerations
Keep an eye on performance, collect feedback, and solve problems after migration. Continuously improve reports. The migration does not mark the end of the process; rather, the periodical checking guarantees the reports to be accurate, quick, and of great value over time.
-
Governance & Lifecycle Management
Establish guidelines on report production, ownership, updating, and deleting. Governance is the force that drives the organization, accuracy, and reliability of reports. The existence of obvious pathways simplifies maintenance and holding back of overcrowding over time.
-
Power BI Adoption & Training Strategies
Train the end-users about dashboards, slicers, and how to navigate through them. Make it clear the interactive features and the value they bring. Well-trained users will be more confident, thus, adoption will be easier and refusal towards the new system will be lesser.
-
Ongoing Maintenance and Optimization
Sometimes check the data models, calculations, and the reports used. Remove the content that is not used, make the queries more efficient, and improve the visuals. Ongoing maintenance makes Power BI to be fast, dependable, and suitable for business needs forever.
Getting the Most Value from Power BI
Many businesses often weigh Crystal Report limitations and Power BI benefits. Once you have completed the change process from Crystal Reports to Power BI, the next move is to extract every benefit that Power BI can give.
- First, configure data updates to happen automatically; thereby, reports continuously display the most up-to-date information without any manual work.
- Next, open up common areas for different teams to allow each department to see and handle its own reports and dashboards.
- Then, develop Power BI dataflows to prepare data one time only and use it across numerous reports, thus, saving the time as well already maintaining the continuity of data.
- Further, make use of the intelligent characteristics like built-in insights and advanced predictive analytics Power BI to uncover trends and patterns better.
- Lastly, improve data safety by setting row-level access permissions so that each user can see only the data that is suitable for him or her.
The business intelligence upgrade becomes even more powerful when the migration is seen as a step towards better data understanding and usage rather than just a boring process of replacing old reports.
Challenges in Migrating from Crystal Reports to Power BI and Ways to Overcome
The change from Crystal Reports to Power BI is not an easy task and involves several difficulties. Major among them are the differences in report aesthetics, data connections, calculations, and user access to reports. If approached rightly through proper planning and a creative design idea, these troubles can be smoothly managed.
-
From Fixed Reports to Interactive Dashboards
The standard output of Crystal Reports was fixed, printed reports with a set layout and little or no changes. On the other hand, Power BI offers vibrant dashboards where the users can click, filter and perform the data exploration. Rather than making a dual copy of the report, the goal should be to understand the reason behind the existence of each report and then reconstruct it to enable user engagement. Sometimes it becomes necessary to trust a reliable partner for Power BI dashboard development services!
-
Handling Different Data Connections
Using Power BI data connectors for legacy systems enables organizations to integrate historical data into modern analytics dashboards. Crystal Reports let a direct connection to the databases using specific drivers. These drivers don’t perform well with Power BI, as it uses connectors which may sometimes lead to connection issues. To prevent this, prepare a list of all the data sources, formulas, and report layouts before the migration begins.
-
Rebuilding Calculations and Business Rules
Crystal Reports uses its own formula language for calculations and rules, while Power BI employs DAX and Power Query. To cope with this, understand what each formula does and recreate the identical logic in Power BI. Maintain a simple document reflecting the conversion of each Crystal formula and conduct testing of the results with great care.
-
Creating a Clean Data Structure
Crystal Reports usually lack a clearly defined data structure. Power BI requires a clean and organized data model for its proper functioning. To tackle this, develop reusable datasets in Power BI and outline the star schema with clear-cut fact and dimension tables.
-
Improving Report Speed
Crystal Reports carry out a query directly to the database every time a report is created. Power BI’s speed is set on by the quality of the data model. To speed up reporting, stick to best practices like star schema design, data collection, and gradual improvement, which are among the ways to refine the performance of Power BI.
-
Redesigning Data Security
In Crystal Reports, safety is taken care of at the report or data level, while in Power BI, it is done through row-level security, which is a different approach. To manage this situation, start by inspecting the current security policies and then use roles in Power BI to create new ones that copy the old ones.
-
Helping Users Adjust to the New System
There are users who will be more or less unsure to switch if they are offered the new Power BI dashboards. So produce no conflict to the usage of Power BI among users, organize a training in which its major advantages and features will be presented to users. Show them all the moves they can make to easily filter out, click the visuals, and go through the dashboards.
Best Practices for a Smooth Crystal Reports to Power BI Migration
Thinking about how to migrate Crystal Reports to Power BI? When transferring data from Crystal Reports to Power BI, besides capturing it as proven methods, it is also critical to ensure that it remains confidential and accurate through the process.
- Start by going through every report with a fine-tooth comb. Identify those that are most important, ones that need to be completely rethought, and the ones that can be just thrown away.
- Then come up with a migration plan that is easy to follow. Set small goals, decide the time frames, and take it one step at a time rather than doing everything at once.
- Confirm that everybody taking part knows what is going on. Disclose the Power BI features to business executives, technical teams, and report users early in the process.
- Use the modern tools that include calculations, filters, drill actions, and visual elements to create new reports inside Power BI, thereby, turning the knowledge into better understanding.
- Using a clean table structure, design the data in an orderly manner that will allow for quick loading and future expansion.
- Set up Power BI to receive updates automatically to reduce the need to run scheduled reports periodically with Crystal Reports.
- Finally, train users on the use of Power BI dashboards, filtering options and self-service data discovery tools to create a good user experience when they are using your BI tool.
Crystal Reports Alternatives Beyond Power BI
While this blog discusses the migration from Crystal to Power BI, there are many alternative BI tools available to businesses; not just Power BI. Companies/businesses should look at various other BI solutions to manage their specific data needs. Some other enterprise reporting migration solutions include:
-
Tableau

Tableau has strong visual representations and lets users drag and drop charts easily. It is an excellent choice for individuals and organizations that want to explore their data using dashboards that attract attention. Many users prefer Tableau for in-depth analysis of data.
-
Qlik

Qlik enables users to explore their data without having to follow a planned path to the answer(s). Secondly, it allows users to quickly filter through large amounts of data and compare data points (KPIs) at the same time. Indeed, it is an excellent choice for users who want to create reports based on the discoveries they make while analyzing data in Qlik.
-
MicroStrategy

MicroStrategy has an enterprise-level reporting solution. It is known for having strong security features, and for being able to produce reports for large numbers of users with complex needs.
-
ThoughtSpot

ThoughtSpot allows users to search for answers using either a keyword search or by asking them in natural language. It makes getting quick answers very easy for users without a high level of technical expertise. Not to forget, it focuses on making self-service analytics.
-
Looker

Looker connects to cloud databases and uses a centralized data model, which helps ensure consistent numbers across teams and is often used by teams that prefer modern cloud-based BI platforms.
On the other hand, Power BI is more widely adopted because of its integration with the Microsoft ecosystem, cost-effectiveness, and ongoing feature improvements.
Cost Planning for Moving Reports to Power BI
By understanding the effect that upgrading from Crystal Reports to Power BI will have on their finances, teams can create suitable budgets and timelines for transitioning this work. A full financial review of their change over from Crystal Reports to Power BI would identify direct costs, indirect expenses, and future benefits.
Clear Spending Areas
There are several expenses that teams can expect to incur during the transition to Power BI:
These are costs you pay directly:
Power BI Licenses
- Power BI Pro is approximately $14/month/user and is useful for sharing/publishing (these are the only users who will need the Power BI Pro license).
- Power BI Premium Per User is approximately $24/month/user for larger datasets and advanced features.
- Premium Capacity (Enterprise): from approximately $5,000/month
Migration Tools and Software
- Depending on the best tools to migrate Crystal Reports to Power BI, migration software and/or connectors may experience additional costs (prices vary by supplier).
- The Crystal Reports to Power BI conversion tool FLIP simplifies and speeds up report modernization.
- Many organizations are moving away from legacy reporting tools to adopt more modern, flexible analytics platforms.
Consulting or Migration Services
Some companies provide a Service Level Agreement on a flat-rate basis for Small (less than 100 items) migrations starting from approximately $2,500. Whereas, the Companies that have implemented or customized these services will typically charge between $100 & $150/hr for customized and complex projects. The average cost of a large implementation will vary according to size ranging from $10,000 – $50,000+.
Training Expenses
- Virtual training sessions can range from about $350/hr for a personalized virtual training session.
- Group (classroom/workshop) sessions often start from $1,650/person and vary throughout the market.
Hidden Effort and Impact
Costs that are linked with migration include, but are not limited to: Employees take time away from their normal duties to help with migration of information and data to new software or applications. Productivity is likely to be delayed when data or information is being moved to a new environment (in this case, Power BI). Teams are likely to take time to learn and adapt to the new applications.
Long-Term Financial Benefits
When cloud migration is completed, many of these costs have been reduced or removed altogether. Staff support decreases greatly; employees complete tasks faster than before; management will be making better decisions based on accurate enterprise data reporting. Many of the old licenses for Crystal Reports are now out of date and no longer needed.
To summarize, there has been a great decrease in the level of maintenance required for Power BI, and greater productivity due to the use of visual, dynamic reports, as well as smarter decision-making based on real-time data and information. Also, there are cost savings from the removal of Crystal Reports licenses.
Why Is NGS Solution Is A Perfect Partner For Crystal Reports To Power BI Migration?
NGS Solution helps organizations make the transition from Crystal Reports to Power BI as easily and quickly as possible by understanding the issues around data integration in Power BI, difficulties around measuring and using complex formula fields. There is a need for redesigning reports into the intuitive dashboard format that Power BI offers to better enable decision making. We claim to offer the best professional BI modernization services!
Call us your ultimate data migration service provider for Power BI! Through the use of established techniques and years of practical experience in providing Crystal Reports to Power BI migration services, NGS ensures that your organizations will be able to migrate to Power BI with little disturbance and ease of adaptation for your users.
To make sure you’re getting the most out of your data in Power BI, partner with NGS Solution so you can experience hassle-free and successful migration! We offer you the spot-on Enterprise BI migration strategy from Crystal reports and hence business logic preservation!
To Wrap Up
The change over from Crystal Reports to Power BI is not simply transferring reports from one platform to another. It is also about upgrading analytical tools, ensuring accurate data inputs/outputs, and providing an interface that promotes improved business intelligence through interaction between the user and the data.
Therefore, for the migration to be successful, organizations need to understand and follow a structured process for migrating their reporting assets: report evaluation, data modelling best practices, formula translation and validation processes. These are essential aspects of any successful migration project.
Additionally, organizations need to consider how to encourage user adoption of the platform, addressing safety concerns and developing future maintenance strategies to make most of the benefits of Power BI. This is significant for businesses who wish to maximize BI modernization or Crystal Reports replacement solution!
Utilizing preset industry best practices allows for organizations to have more speed, scale and reliability with their reporting capabilities. Without any doubt, NGS Solution provides organizations with a total source for the migration of Crystal Reports to Power BI. We have experts who provide services such as data preparation, Crystal Reports formula conversion to DAX, dashboard development and user training to achieve the best overall experience possible for our client’s migration projects.
Hire experts for Power BI migration at NGS Solution! Our company is your partner for creating a successful migration strategy tailored to your business needs so that you can maximize the capabilities of Power BI! Let’s begin and contact NGS Solutions today to preserve business logic during Power BI migration! We are your ultimate partners for Power BI migration consulting!
FAQs
-
How do I assess which Crystal Reports to migrate first?
The most effective way to know which Crystal Reports should be migrated first is to check the frequency of use of each report and how critical that report is to the success of the organization. Reports that support the organization’s daily operations or have a high financial or executive reporting impact should be in the spotlight in the initial migration efforts. In contrast, reports that are seldom utilized or are no longer relevant to the organization can typically be delayed or completely removed from the migration process, saving time and resources.
-
Why is data modeling important during BI migration?
A data model provides the relationships between data tables or sources as well as the calculations. With a properly constructed data model, reports will be easier to create and will produce faster results and higher-quality information. Failure to sufficiently model will lead to inaccurate numbers and performance issues for reports, irrespective of whether or not the migration was completed technically. There are predefined Power BI data modelling best practices.
-
How do you convert Crystal Reports formulas into DAX?
You cannot simply copy your Crystal Report formulas into DAX. You must first understand how the original formula gives you the answer you are seeking, such as a total(s), average(s), conditional logic, etc. After understanding what you are calculating, you need to build a similar expression using DAX in the BI application. This will ensure that your calculations work in the new BI system.
-
When should you choose manual migration over an automated tool?
When reports contain complex logic or custom logic that needs to be modified or improved during the migration, manual migration is the best choice. While automated Crystal Reports conversion tools can quickly handle simple reports, many of them struggle with complex formatting as well as calculation logic used in those reports. With manual migration, you have the opportunity to clean up, optimize, and update your reports.
-
What happens if migrated reports don’t match original results?
If the migrated report does not present matching values compared to the original values, typically it shows differences in calculated values, filter conditions, or the handling of source data. Therefore, to address these differences, it is necessary to perform a detailed analysis of both reports to identify where the differences occur and then adjust logic and/or model based on the results of this validation process. Performing this analysis and making necessary adjustments on your reports is good practice to ensure you are generating your users’ confidence to use the new reports.
-
How do DirectQuery and Import storage modes impact migration?
Import Mode (where the report stores a copy of the data within the BI product) typically results in faster query response times and more responsive reporting based on the extra performance overhead of importing data into the BI product. Direct Query Mode (where you create a live connection between your BI product and your source) generally may result in slower querying and reporting performance but provides up-to-date information with every query. Therefore, finding the optimum storage mode for your reports is critical to how fast your users receive data, how often your users receive updated information, and how the user receives updated information during the migration process.
-
How to validate security and access after migration?
After the migration, you will want to confirm that users will have access only to the data allowed for their user identity level. That includes validating the assigned user role, any data access restrictions based on their user identity level, and any permissions granted to the user for viewing the report based on the user’s assigned role. Proper validation and data accessibility and governance for all types of sensitive information will provide assurance of protecting sensitive information and compliance with security policies.
-
What are common pitfalls in Crystal Reports migration projects?
Typical errors in Crystal Reports migrations include: failure to take into consideration Data Modeling, underestimating the complexity of reports, and not including User Testing. Migration of Reports that were not being actively used or the attempt of duplicating all aspects of the Report rather than improving them can be harmful as well. By properly planning and including users in the process, many of these issues can be avoided.
-
How to measure migration success?
When reports are producing the same or accurate results, load faster, and are easier to navigate, these are signs of a successful migration. User adoption or trust in the reports and preference to use the new reports system as well as a reduction in errors and support requests are additional indicators of success.


